Background
This script provides a demonstration of some tools that can be used to conduct a reliability analysis in R.
1. What you need before starting.
R
We used the latest version of R installed on a machine with the Windows Operating System. This, and most R packages (but see below), are available for download from the Comprehensive R Archive Network website (CRAN: https://cran.r-project.org/).
R packages, source script and data files.
There are other software programs currently available for conducting Reliability analyses such as Weibull++ (see http://www.reliasoft.com/Weibull/index.htm) and the SPLIDA add-on for S-PLUS (see http://www.public.iastate.edu/~splida/), for instance. From our experience, none of the R packages currently available on CRAN are sufficient to complete a comprehensive Reliability analysis in themselves, although they do provide some relevant analytical tools. For these examples, we use the SPREDA package, plus an additional R source script of custom-written functions.
In addition, there are two R packages (that we know of) that are currently in development: RSPLIDA (http://www.public.iastate.edu/~stat533/) and abrem (visit http://www.openreliability.org and follow the links), although we don’t use these here.
The “SPREDA”, “lattice”, and “boot” packages
These packages are available for installation from CRAN, which can be done using the install.packages() function typed into the R console, or as selected from the Packages tab in Rstudio. Make sure dependencies are also downloaded and installed. Type help(install.packages) in the R console for further details.
The R script and data file.
Download the ReliabilityAnalysisInR_Rscript.R file from (here). This is all you need, as a separate R script containing the custom-written funactions (ReliabilitySupportFns.R) and the example data file (EXA1.csv) are both loaded directly from the same Github location, from within this script.
2. This example analysis.
In this example script our aim is to demonstrate how reliability analyses can be conducted in R and thus we present only some of the analytical tools available. We do not attempt to provide an exhaustive coverage of the topic and recommend that those wishing to undertake such analyses consult the relevant texts and literature beforehand. The Meeker and Escobar (1998) text (see “References cited” below) provides a comprehensive coverage.
Dataset.
We present an example analysis of a dataset of time-to-failure measurements that includes censored measurements \((n=127)\). Censoring is the process of coding usage (e.g., time) measurements taken where failures have not occurred. For instance, a right-censored observation (or suspension) may occur because the item is still functioning at the time of measurement.
These data represent failures of Ground Engaging Tools (GET) used in hard rock mining excavators. This dataset comes from a single excavator over an 8 year period.
Ground engaging tools attach to the excavator bucket, they are also known as “teeth” due to their similarity in shape to human teeth. There are usually between 5 and 8 teeth on a bucket. GET are designed to wear out and are replaced when they functionally fail. This functional failure is defined by the ability of the tooth to penetrate the rock and power required. Each failure/ suspension event in the data represents the replacement of one or more teeth. The records do not state how many teeth are replaced at each event.
These data were collected as part a mobile mining equipment database described in Ho (2016). Details on the data collection, cleaning and processing are described in Hodkiewicz and Ho (2016).
Objective of the analysis.
We are interested in estimating some properties of the reliability of a system, or of a component of a system, including predicting the mean time-to-failure (MTTF).
Analysis models.
For simplicity here we assume the distribution of time-to-failure measurements are well approximated by the 2-parameter Weibull distribution. The validity of this assumption, however, is arguable (see below) and we do not recommend making this assumption in all cases. Accordingly, we also present some tools for evaluating the suitability of some alternative parametric distributions (following Meeker & Escobar 1998).
The probability density function \(f(t)\) of the 2-parameter Weibull distribution is defined for the random variable \(T\), which is the lifetime of a component or system (i.e., where \(P[T=t] = f(t)\)):
$$
f(t)=\frac{\beta}{\eta}\left(\frac{t}{\eta}\right)^{\beta-1}e^{
-\left(\frac{t}{\eta} \right)^{\beta}
}
$$
For reliability analysis, \(t\) is some measure of usage (e.g., total operating or running time) and \(\beta, \eta\) are “shape” and “scale” parameters, and each can also be interpreted as having a specific meaning (see below).
We use maximum likelihood estimation (MLE) to estimate these parameters of the Weibull distribution (\(\hat{\beta}, \hat{\eta}\)). This, in turn, allows us to estimate the expectation, or centre of mass, of the Weibull probability density function (PDF) for \(T\), \(\mathbb{E}[T]\). The estimate of MTTF is then taken as the \(\mathbb{E}[T]\), as predicted from, and contingent upon the assumptions of, this analysis model. An alternative method for estimating these parameters is from using Median Ranked Regression (MRR; e.g., see Abernethy 2003, O’Connor and Kleyner 2012). A recent study by Genschel and Meeker (2010) demonstrated that, for most datasets, MLE was likely to produce more reliable estimates of Weibull parameters than MRR, and that this was consistent with evidence from several other independently published studies. Please refer to Genschel and Meeker (2010) for further details.
We caution, however, that one should always assess appropriate diagnostics to evaluate the validity of model assumptions for every dataset analysed, and acknowledge sources of uncertainty in every new set of results (e.g., see Meeker and Escobar 1998).
Analyses.
1. Load required packages, functions and datasets.
Firstly, we need to load the SPREDA, boot, and lattice packages:
library(SPREDA)
library(boot)
library(lattice)
For a brief overview of R packages you can type commands such as library(help="SPREDA") or help("SPREDA-package"). Next, load the file ReliabilitySupportFns.R, which contains additional functions that we’ll be using.
source("https://raw.githubusercontent.com/CodeOwl94/ross-reliability/master/ReliabilitySupportFns.R")Next we need to load the dataset. Here, we load a comma separated values (csv) file:
exa1 <- read.csv("https://raw.githubusercontent.com/CodeOwl94/ross-reliability/master/EXA1.csv",
                 header=T)
dim(exa1)
## [1] 127 2A csv file can be prepared by saving these data, once appropriately formatted (see below) in an MS Excel worksheet, as this type of file using the “Save As” option, as selected from the “File” menu in Excel. The header=T argument is specified as we wish to retain the appropriately labelled data columns within the data frame object, which R converts it into, by default.
NOTE: If, after stepping through this example script, you wish to apply these functions to analyse your own dataset, you will need to firstly reformat your data into a .csv file, and then load it into R, as demonstrated above. However you will need to enter your file name as the first argument of the read.csv() function instead. There are other ways of importing data into R, but if you need more information about this method, type the command help(read.csv).
Our data appear to have been read into R OK; we know this because the dim() function returned the values 127 and 2, which correspond to the 127 rows and 2 columns of data in the original data file. Always check this, as errors may occur in this step, such as columns of missing values or due to extra commas in the dataset prior to csv file conversion. Now, lets have a look at these data:
head(exa1) # returns the first 6 rows:## fail time
## 1 F 57
## 2 F 7
## 3 F 21
## 4 F 7
## 5 S 76
## 6 F 22stack(table(exa1$fail))## values ind
## 1 123 F
## 2 4 SPrior to importing this file, we coded the values in the fail column as:
- F, Failure: a valid time-to-failure measurement, or
- S, Suspension: a right censored measurement.
It is sensible to code observations in a manner that helps us to clearly identify what they represent. However, now we need to recode these fail values into values of 1 and 0 respectively, because the SPREDA package recognises this binary coding for fail data:
- 1, Failure: a valid time-to-failure measurement, or
- 0, Suspension: a right censored measurement.
exa1$fail <- ifelse(exa1$fail=="S","T",as.character(exa1$fail))
exa1.dat <- data.frame(time=exa1$time,
                       event=1-as.numeric(as.logical(exa1$fail)))
stack(table(exa1.dat$event))
## values ind
## 1 4 0
## 2 123 1The ifelse() function is necessary to code the suspensions so that the subsequent line can format fail appropriately. If the data were complete time-to-failure measurements (i.e., no censored data) the ifelse() statement can be omitted.
str(exa1.dat)## 'data.frame': 127 obs. of 2 variables:
## $ time : int 57 7 21 7 76 22 51 27 8 18 ...
## $ event: num 1 1 1 1 0 1 1 1 1 1 ...head(exa1.dat)## time event
## 1 57 1
## 2 7 1
## 3 21 1
## 4 7 1
## 5 76 0
## 6 22 1The fifth row contains a censored measurement.
2. Graphical analysis.
Now lets look at these data. Importantly, this step helps to understand these data prior to fitting any models or making strong model assumptions (Meeker and Escobar, 1998). Results will inform initial decisions made during subsequent model fitting.
Plot.Observations(exa1.dat)
title("Figure 1", adj=1)
This figure shows the sorted raw failure times, with censored times coloured in red. This is a little difficult to see, so instead we plot for subsets of these data. First, we look at the observations ranked 1 to 60, in terms of time measurement (low to high):
Plot.Observations(exa1.dat[order(exa1.dat$time),][1:60,])
title("Figure 2", adj=1)
The 47.5th ranked observation, which is tied with three other measurements, is a right-censored measurement or suspension. Zooming in on the remaining time measurements (longer operating times):
Plot.Observations(exa1.dat[order(exa1.dat$time),][61:nrow(exa1.dat),],
                  Ntotal=nrow(exa1.dat))
title("Figure 3", adj=1)
The second argument in Plot.Observations() is required if the subset does not start at observation 1. We see that three other censored measurements occur at ranks 74, 103.5, 124. These rankings of censored observations, in order of total running time, were obtained using
sort(rank(exa1.dat$time,ties.method="average")[exa1.dat$event==0])## [1] 47.5 74.0 103.5 124.0OK. Now, let’s have a look at the empirical cumulative frequency distribution of the complete time-to-failure measurements.
plot(ecdf(exa1.dat[exa1.dat$event==1,"time"]),main="",xlab="time",
     verticals=T,las=1,adj=0.5)
abline(v=quantile(exa1.dat[exa1.dat$event==1,"time"],probs=c(0.25,0.5,0.75)),
                  col='red',lwd=2,lty=2) # add on quartiles
title("Figure 4", adj=1)
Later, we adjust these relative frequencies for the censored observations to obtain non-parametric estimates of the probability of failure with time, \(F(t)\).
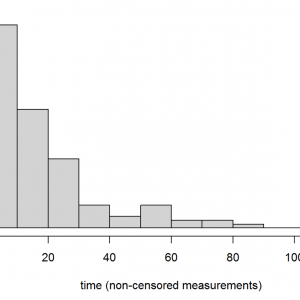
Next we can inspect the sampled frequencies as a histogram:
hist(exa1.dat[exa1.dat$event==1,"time"],main="",col="lightgrey",
     xlab="time (non-censored measurements)",las=1,adj=0.5)
title("Figure 5", adj=1)
Right-skewed distributions are typical of reliability data. Are these data from a single distribution? If there are unusual (e.g. multi-modal) patterns it might be worth seeking additional information about how these data were sampled. Also, we can return the plotted values by assigning the above command to a named object (exa1.hist), setting the plot=F argument, and inspecting the named elements of the returned list object.
exa1.hist <- hist(exa1.dat$time,plot=F)
attach(exa1.hist) # makes the list element names of exa1.hist into global objects.
data.frame(time=mids,n=counts)
## time n
## 1 5 54
## 2 15 32
## 3 25 19
## 4 35 6
## 5 45 3
## 6 55 6
## 7 65 2
## 8 75 3
## 9 85 1
## 10 95 0
## 11 105 0
## 12 115 1detach(exa1.hist) # removes attached exa1.hist elements from the workspace.
rm(exa1.hist) # removes exa1.hist from our workspace, as we are finished with it.The printed data frame shows the sampled frequencies of failure time measurements (n, column 2) alongside the mid-points of time for each time bin in the histogram, which gives us a better feel for these data. This table shows that the majority of failures (i.e., approximately 85 % of non-censored measurements) occurred prior to time 30, with small sample sizes for bins thereafter (and especially after time 60), which should be borne in mind when interpretting results.
Next we construct probability plots, as suggested in Meeker and Escobar (1998), to identify which distribution(s) may provide a good approximation of these data.
Probability.Plots(exa1.dat)## [1] "Adjustments to 95 % simultaneous confidence bounds to account for"
## [1] "non-increasing values follow method of Meeker & Escobar (1998)"
# title("Figure 6", adj=1)These plots can be interpretted thus:
- If the points lie in a straight line then this suggests that the corresponding distribution may be suitable for modelling this dataset.
- 95 % simultaneous confidence bands show the uncertainty for these measurements across the range of sampled times
- If a linear fit to these data falls within these bounds (i.e., from the next step of this analysis) that is further evidence in support of that distribution.
Interpretation of the presented probability plots:
The plotted \(\hat{F}(t)\) against \(t\) on the Normal scale are clearly non-linear, which suggests that this distribution is likely to provide a poor description of the sampled times. The relatively wide confidence bands on the Exponential plot indicate high uncertainty for higher values (observations for longer running times, lengthier times to failure) fitting that distribution (although the linearity in plotted points suggests that it perhaps should not be discounted at this stage). The plotted points on the 2 parameter Weibull and Lognormal scales look fairly linear, although it could be argued that times earlier than 7 units may not be consistent with later times, as approximated by the 2-parameter Weibull. This may also suggest a case for investigating the fit of the 3-parameter Weibull model to these data.
We can zoom in to have a closer look at any of these graphs using the dist argument:
Probability.Plots(exa1.dat,dist="Weibull")## [1] "Adjustments to 95 % simultaneous confidence bounds to account for"
## [1] "non-increasing values follow method of Meeker & Escobar (1998)"title("Figure 7", adj=1)
If desired, we can also add gridlines using the gridlines=T argument for this function.
3. Fit models and estimate parameters.
First, we fit the Weibull model using the Lifedata.MLE() function of the SPREDA package.
exa1.spreda <- Lifedata.MLE(Surv(time,event)~1,
                            data=exa1.dat,
                            dist="weibull")
summary(exa1.spreda)
## Call:
## model.frame(formula = Surv(time, event) ~ 1, data = exa1.dat)
##
## Parameters:
## mean std 95% Lower 95% Upper
## (Intercept) 3.0595060 0.08450988 2.8938666 3.225145
## sigma 0.8906071 0.05894954 0.7822469 1.013978
##
## Loglikelihod:
## [1] -492.5143
##
## Covariance matrix:
## [,1] [,2]
## [1,] 0.007141919 -0.001552141
## [2,] -0.001552141 0.003475048
##
## Survival probability:
## [1] 0.048934440 0.750964862 0.374068348 0.750964862 0.015487368
## [6] 0.354855552 0.069736281 0.271471160 0.716968860 0.437344331
## [11] 0.174647555 0.354855552 0.858315281 0.147520242 0.001400637
## [16] 0.821776662 0.336530164 0.374068348 0.030296987 0.415281940
## [21] 0.374068348 0.684020172 0.895288306 0.012869483 0.785937240
## [26] 0.484526659 0.257111426 0.509700112 0.750964862 0.821776662
## [31] 0.821776662 0.895288306 0.058451987 0.652163102 0.184684971
## [36] 0.652163102 0.750964862 0.509700112 0.257111426 0.895288306
## [41] 0.621422754 0.354855552 0.460416631 0.271471160 0.271471160
## [46] 0.460416631 0.621422754 0.821776662 0.785937240 0.858315281
## [51] 0.621422754 0.858315281 0.750964862 0.785937240 0.858315281
## [56] 0.895288306 0.621422754 0.591810018 0.652163102 0.394200094
## [61] 0.591810018 0.652163102 0.785937240 0.437344331 0.104744406
## [66] 0.286562177 0.716968860 0.048934440 0.484526659 0.785937240
## [71] 0.621422754 0.563325060 0.821776662 0.652163102 0.104744406
## [76] 0.750964862 0.785937240 0.821776662 0.684020172 0.750964862
## [81] 0.062002910 0.165123214 0.243453079 0.008863639 0.484526659
## [86] 0.621422754 0.563325060 0.374068348 0.750964862 0.858315281
## [91] 0.374068348 0.415281940 0.821776662 0.022368118 0.019796664
## [96] 0.750964862 0.394200094 0.535959861 0.184684971 0.484526659
## [101] 0.785937240 0.437344331 0.821776662 0.055097026 0.895288306
## [106] 0.684020172 0.821776662 0.716968860 0.484526659 0.858315281
## [111] 0.394200094 0.621422754 0.750964862 0.858315281 0.591810018
## [116] 0.147520242 0.621422754 0.509700112 0.124401513 0.230466881
## [121] 0.895288306 0.243453079 0.271471160 0.858315281 0.684020172
## [126] 0.716968860 0.785937240This function uses, as its first argument, a formula for the model. This is formulated using the Surv() function from the dependent survival package. Type help(Surv) for further information on this function, which can handle different types of reliability data, including interval data. The terms to the right of the ~ are the explanatory terms in the model - here we type a 1 to denote that there are no additional explanatory terms.
The estimated parameters by this model are transformed parameters \(\mu\) (Intercept) and \(\sigma\) (sigma), following Meeker and Escobar (1998). To obtain the MLEs of the Weibull parameters, we need to back-transform these estimates, each for \(\hat{\beta}\)
(beta.spreda <- 1 / unname(exp(exa1.spreda$coef[2])))## [1] 1.12283(The unname() function is required to remove the label assigned to each of the respective coefficients, which are elements of the returned exa1.spreda object.)
and for \(\hat{\eta}\)
(eta.spreda <- unname(exp(exa1.spreda$coef[1])))## [1] 21.31702We can also obtain approximate 95 % confidence limits for \(\hat{\beta}\) and \(\hat{\eta}\) using these functions and the confidence limits obtained for the \(\hat{\sigma}\) and \(\hat{\mu}\) MLEs:
beta.95cl_hi <- 1 / (summary(exa1.spreda)$coefmat["sigma","95% Lower"])
beta.95cl_lo <- 1 / (summary(exa1.spreda)$coefmat["sigma","95% Upper"])
eta.95cl_lo <- exp(summary(exa1.spreda)$coefmat["(Intercept)","95% Lower"])
eta.95cl_hi <- exp(summary(exa1.spreda)$coefmat["(Intercept)","95% Upper"])
(beta.ests <- c(lower=beta.95cl_lo,est=beta.spreda,upper=beta.95cl_hi))
## lower est upper
## 0.9862148 1.1228296 1.2783688(eta.ests <- c(lower=eta.95cl_lo,est=eta.spreda,upper=eta.95cl_hi))## lower est upper
## 18.06302 21.31702 25.15723As explained in Meeker and Escobar (1998), this is appropriate for those quantities that are a monotonic function of another parameter. For quantities that depend on more than one parameter more sophisticated methods may be required to obtain accurate interval estimates. As shown for the last two lines of code, enclosing a whole line within brackets will print the result (i.e., eta.ests) to the console. This is an efficient way to assign a name to an R object, as well as inspecting its value(s).
So, how well does this model fit our data? To visually assess this, we can superimpose on the Weibull probability plot the fitted model (linear on this scale) and see whether it falls within the simultaneous 95% confidence bands for the \(\hat{F}(t)\):
Probability.Plots(exa1.dat,dist="Weibull")## [1] "Adjustments to 95 % simultaneous confidence bounds to account for"
## [1] "non-increasing values follow method of Meeker & Escobar (1998)"# Get transformed time (x axis) and Fhat (y axis) values:
Weibull.xval <- log(Calculate.Fhat(exa1.dat)$time)
exa1.Fhat <- Calculate.Fhat(exa1.dat)$Fhat
Weibull.yval <- log(-log(1-exa1.Fhat))
# Get intercept and slope of mle fit on linear scale:
Weibull.slope <- 1 / beta.spreda
Weibull.intercept <- log(eta.spreda)
# Plot as a red coloured line:
lines(x = Weibull.slope*Weibull.yval + Weibull.intercept,
y = Weibull.yval,
col='red', lwd=2)
title("Figure 8", adj=1)
According to this criterion, the fit of the Weibull model is consistent with these data as it falls within the 95% simultaneous confidence bounds. However, there may be other models that may fit the data equivalently well or better (e.g., Lognormal?). But you get the idea.
The joint uncertainty of the estimated Weibull model parameters is presented as the 95 % confidence region calculated for \(\hat{\beta}\) and \(\hat{\eta}\). A plot is generated using Weibull.Confidence.Region():
Weibull.Confidence.Region(data=exa1.dat,
                          model=exa1.spreda,
                          probability=0.95,
                          show.contour.labels="FALSE",
                          title="Figure 9")
The probability argument is used to specify the probability level (i.e., \(1-\alpha\)) and thus is a value between 0 and 1. An additional steps argument can be set if desired, whereby increasing its value above the default of steps=100 increases the number of values to step through for each parameter, thus increasing the resolution (and time taken) for calculating the plotted values. The time taken increases exponentially with number of steps, so we suggest not increasing this value by too much.
If you want to show confidence regions for different probability levels on the same plot, for instance, enter probability=c(0.05,0.5,0.9,0.95) for the probability argument, as well as show.contour.labels="TRUE".
4. Inference.
What can we learn about the reliability of this component or system from this fitted model?
Well, firstly, the value of \(\hat{\beta}=\) 1.12 is near 1, and the approximate 95% confidence interval for \(\hat{\beta}\) of [0.99, 1.28] contains 1, which suggests that there is neither evidence for failures predominantly occurring due to ageing or wearout effects (i.e., \(\hat{\beta}\) is not high), nor due to early failures, such as may occur due to manufacturing defects (i.e., \(\hat{\beta}\) is not low).
- Plot the failure rate or hazard function \(h(t)\), which describes the likelihood of failure during the next time increment \(\left(\mathrm{i.e.,}\qquad dR/dt=-h(t)R(t)\right)\), using:
hazard.plot.w2p(beta=beta.spreda,eta=eta.spreda,time=exa1.dat$time,line.colour="blue")
title("Figure 10", adj=1)
As the \(\hat{\beta}\) is only slightly above 1 and below 2, we knew that there was not a large increase in the failure rate with increasing time. A steeper increase in the hazard function occurs earlier, than later, in the life of this component or system (given model assumptions).
- Plot the Reliability function \(R(t)\).
Reliability.plot.w2p(beta=beta.spreda,eta=eta.spreda,time=exa1.dat$time,line.colour="blue")
# Then add a vertical line at t=30 to this plot:
abline(v=30,col="lightgray",lty=2)
title("Figure 11", adj=1)
This shows the trend of Reliability (the probability that the component or system is still functioning at time \(t\)) with \(t\).
- Calculate probability of failure (Unreliability) by time 30\(t\)
Calc.Unreliability.w2p(beta=beta.spreda,eta=eta.spreda,time=30)## [1] 0.7695331So, in terms of the above plot, the corresponding Reliabilty by time 30\(t\) is:
(Rel.30 <- round(1 - Calc.Unreliability.w2p(beta=beta.spreda,eta=eta.spreda,time=30),3))## [1] 0.23Check this by calculating the corresponding time to get this Reliability (input argument R) using Calc.Warranty.w2p():
Calc.Warranty.w2p(beta=beta.spreda,eta=eta.spreda,R=Rel.30)## [1] 30.03691Checks out, aside from a small rounding error.
- MTTF
Calculate the MTTF from the \(\mathbb{E}[T]\) using \(\hat{\beta}\) and \(\hat{\eta}\).
(MTTF.exa1 <- Weibull.2p.Expectation(eta=eta.spreda,beta=beta.spreda))## [1] 20.43413Now, in order to calculate the 95% Confidence intervals for MTTF we can obtain relatively accurate estimates using a computer-intensive method known as bootstrapping. Here we use the “bias-corrected percentile” method (e.g., see Section 13.7 of Meeker and Escobar (1998)), although there are other methods (e.g., studentized or “bootstrap-t” method). On a standard laptop this may take 10-15 mins to run, so you may want to get a cup of tea before running …
set.seed(123) # for reproducibility.
(aa <- Sys.time())
## [1] "2016-06-30 10:31:51 PDT"MTTF.boot.95CI.bca <- boot(data=exa1.dat,
statistic=MTTF.boot.percentile.adj,
R=10000)
MTTF.boot.95CI.bca##
## ORDINARY NONPARAMETRIC BOOTSTRAP
##
##
## Call:
## boot(data = exa1.dat, statistic = MTTF.boot.percentile.adj, R = 10000)
##
##
## Bootstrap Statistics :
## original bias std. error
## t1* 20.43413 -0.005520229 1.848863(MTTF.boots.bca <- boot.ci(MTTF.boot.95CI.bca,conf=0.95,type="bca"))## BOOTSTRAP CONFIDENCE INTERVAL CALCULATIONS
## Based on 10000 bootstrap replicates
##
## CALL :
## boot.ci(boot.out = MTTF.boot.95CI.bca, conf = 0.95, type = "bca")
##
## Intervals :
## Level BCa
## 95% (17.26, 24.66 )
## Calculations and Intervals on Original Scalebb <- Sys.time()
(Time.taken <- bb-aa)## Time difference of 11.49119 minsMTTF.95cl_lo <- MTTF.boots.bca$bca[length(MTTF.boots.bca$bca)-1]
MTTF.95cl_hi <- MTTF.boots.bca$bca[length(MTTF.boots.bca$bca)]
(MTTF.ests <- c(lower=MTTF.95cl_lo,est=MTTF.exa1,upper=MTTF.95cl_hi))## lower est upper
## 17.25680 20.43413 24.65681Compare the MTTF to an empirical estimate for the non-censored failures:
mean(exa1.dat[exa1.dat$event==1,"time"])## [1] 19.34959That this value is close to the Weibull MLE for \(\mathbb{E}[T]\) likely reflects that there was a relatively small proportion of censored measurements in this dataset. See Ebeling (1997), pp 286—302, for further information on empirical estimation.
Plot the estimated Weibull pdf of t, with \(\mathbb{E}[T]\) superimposed as a vertical solid line, with the approximate 95% confidence bounds for \(\mathbb{E}[T]\) shown as dashed lines.
xfit <- seq(0,max(exa1.dat$time),by=0.01)

mle.pdf <- dweibull(xfit,shape=beta.spreda,
                     scale=eta.spreda)
plot(xfit,mle.pdf,type='l',col='red',
     xlab="Time To Failure",ylab="f(t)",
     ylim=c(0,1.25*max(mle.pdf)),bty='l',
     las=1,adj=0.5,cex.lab=1.2,cex.axis=0.85)

lines(rep(MTTF.exa1,2),c(0,dweibull(MTTF.exa1,
      shape=beta.spreda,scale=eta.spreda)),
      lwd=2,col='red')
lines(rep(MTTF.95cl_lo,2),c(0,dweibull(MTTF.95cl_lo,
      shape=beta.spreda,scale=eta.spreda)),lty=2,
      lwd=2,col='red')
lines(rep(MTTF.95cl_hi,2),c(0,dweibull(MTTF.95cl_hi,
      shape=beta.spreda,scale=eta.spreda)),lty=2,
      lwd=2,col='red')
title("Figure 12", adj=1)
Compare this to Figure 5, a histogram of the non-censored time measurements. As it looks similar, and given the relatively small proportion of censored measurements in this dataset, this is further evidence to infer that this model has adequately captured the properties of this dataset. However, more formal tests could be conducted (see Meeker and Escobar, 1998). This also demonstrates that the Weibull distribution is quite flexible in that it can approximate the Exponential distribution (when \(\beta=1\)) as well as right-skewed and symmetric unimodal distributions. We can also see that the approximate 95 % confidence interval for \(\mathbb{E}[T]\), our estimate of mean time to failure, is non-symmetrical, reflecting the skewed distribution of failure times.
Importantly, parameter estimates should be interpretted in context of knowledge of the system and of the sampled data. That is, do these results make sense? What does this mean for maintenance of this system?
References cited
Abernethy, R. (2003) The New Weibull Handbook. 5th ed. Dr Robert Abernethy.
Ebeling, C.E. (1997) An Introduction to Reliability and Maintainability Engineering. Waveland Press, Inc. Long Grove, USA.
Genschel, U., Meeker, W.Q. (2010) A comparison of Maximum Likelihood and Median-Rank Regression for Weibull Estimation. Quality Engineering 22: 236-255.
Hodkiewicz, M., Ho, M. (2016) Cleaning historical maintenance work order data for reliability analysis. Journal of Quality in Maintenance Engineering 2(2): 146-163.
Ho, M.T. (2016) A shared reliability database for mobile mining equipment. Ph.D. thesis, University of Western Australia.
Meeker, W.Q., Escobar, A. (1998) Statistical Methods for Reliability Data. Wiley series in probability and statistics. Applied probability and statistics. John Wiley & Sons, Inc. Canada.
O’ Connor, P.T.D., Kleyner, A. (2012) Practical Reliability Engineering. 5th ed. John Wiley & Sons, Ltd. West Sussex, United Kingdom.
Acknowledgements
We thank Dr Jason K. Freels, Prof. W. Q. Meeker and Jurgen Symynck for their advice, as well as the Centre for Applied Statistics at the University of Western Australia. We also thank those of you (in advance) who have provided constructive feedback and suggestions to help improve this resource.
About our group
This R script and web document was developed by Dr Ross J. Marriott with support from Professor Melinda Hodkiewicz and Ashwin D’Cruz of the System Health Team at the University of Western Australia (School of Mechanical & Civil Engineering). This resource was developed as a tool for conducting reliability analysis. More information about our team can be found here.
Dr Ross Marriott is completing a Masters (Research) degree in Mathematics and Statistics at the University of Western Australia. He has a background in Fisheries Research and Stock Assessment, having previously worked for the Department of Fisheries Western Australia (2006-2014) and has obtained a PhD in Marine Biology from James Cook University (2005). Ross has gone back to study to further develop his knowledge and skills to progress his career as an Applied Statistician.