Use of microcontrollers and MEMS for condition monitoring.

The traditional methods for high frequency data analysis involve many piezoelectric sensors, signal amplifiers and spectrum analysers the size of a modern day desktop computer. However, with the arrival of low cost and easy to use microcontrollers and Micro Electromechanical Systems (MEMS), perhaps it’s time to reconsider some of the traditional methods. This blog post aims to outline some of the challenges, limitations and success encountered whilst trying to use a combination of microcontroller and MEMS devices for condition monitoring.

The equipment:

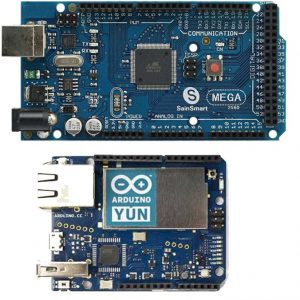
  • Arduino MEGA 2560: . The large user community along with extensive libraries available make this an ideal choice for experimentation.
  • ADXL345: The ADXL345 is a small, thin, low power, 3-axis accelerometer with a measurement range of upto ±16 g.


ADXL345 (Left) & PCB. Coin for scale.

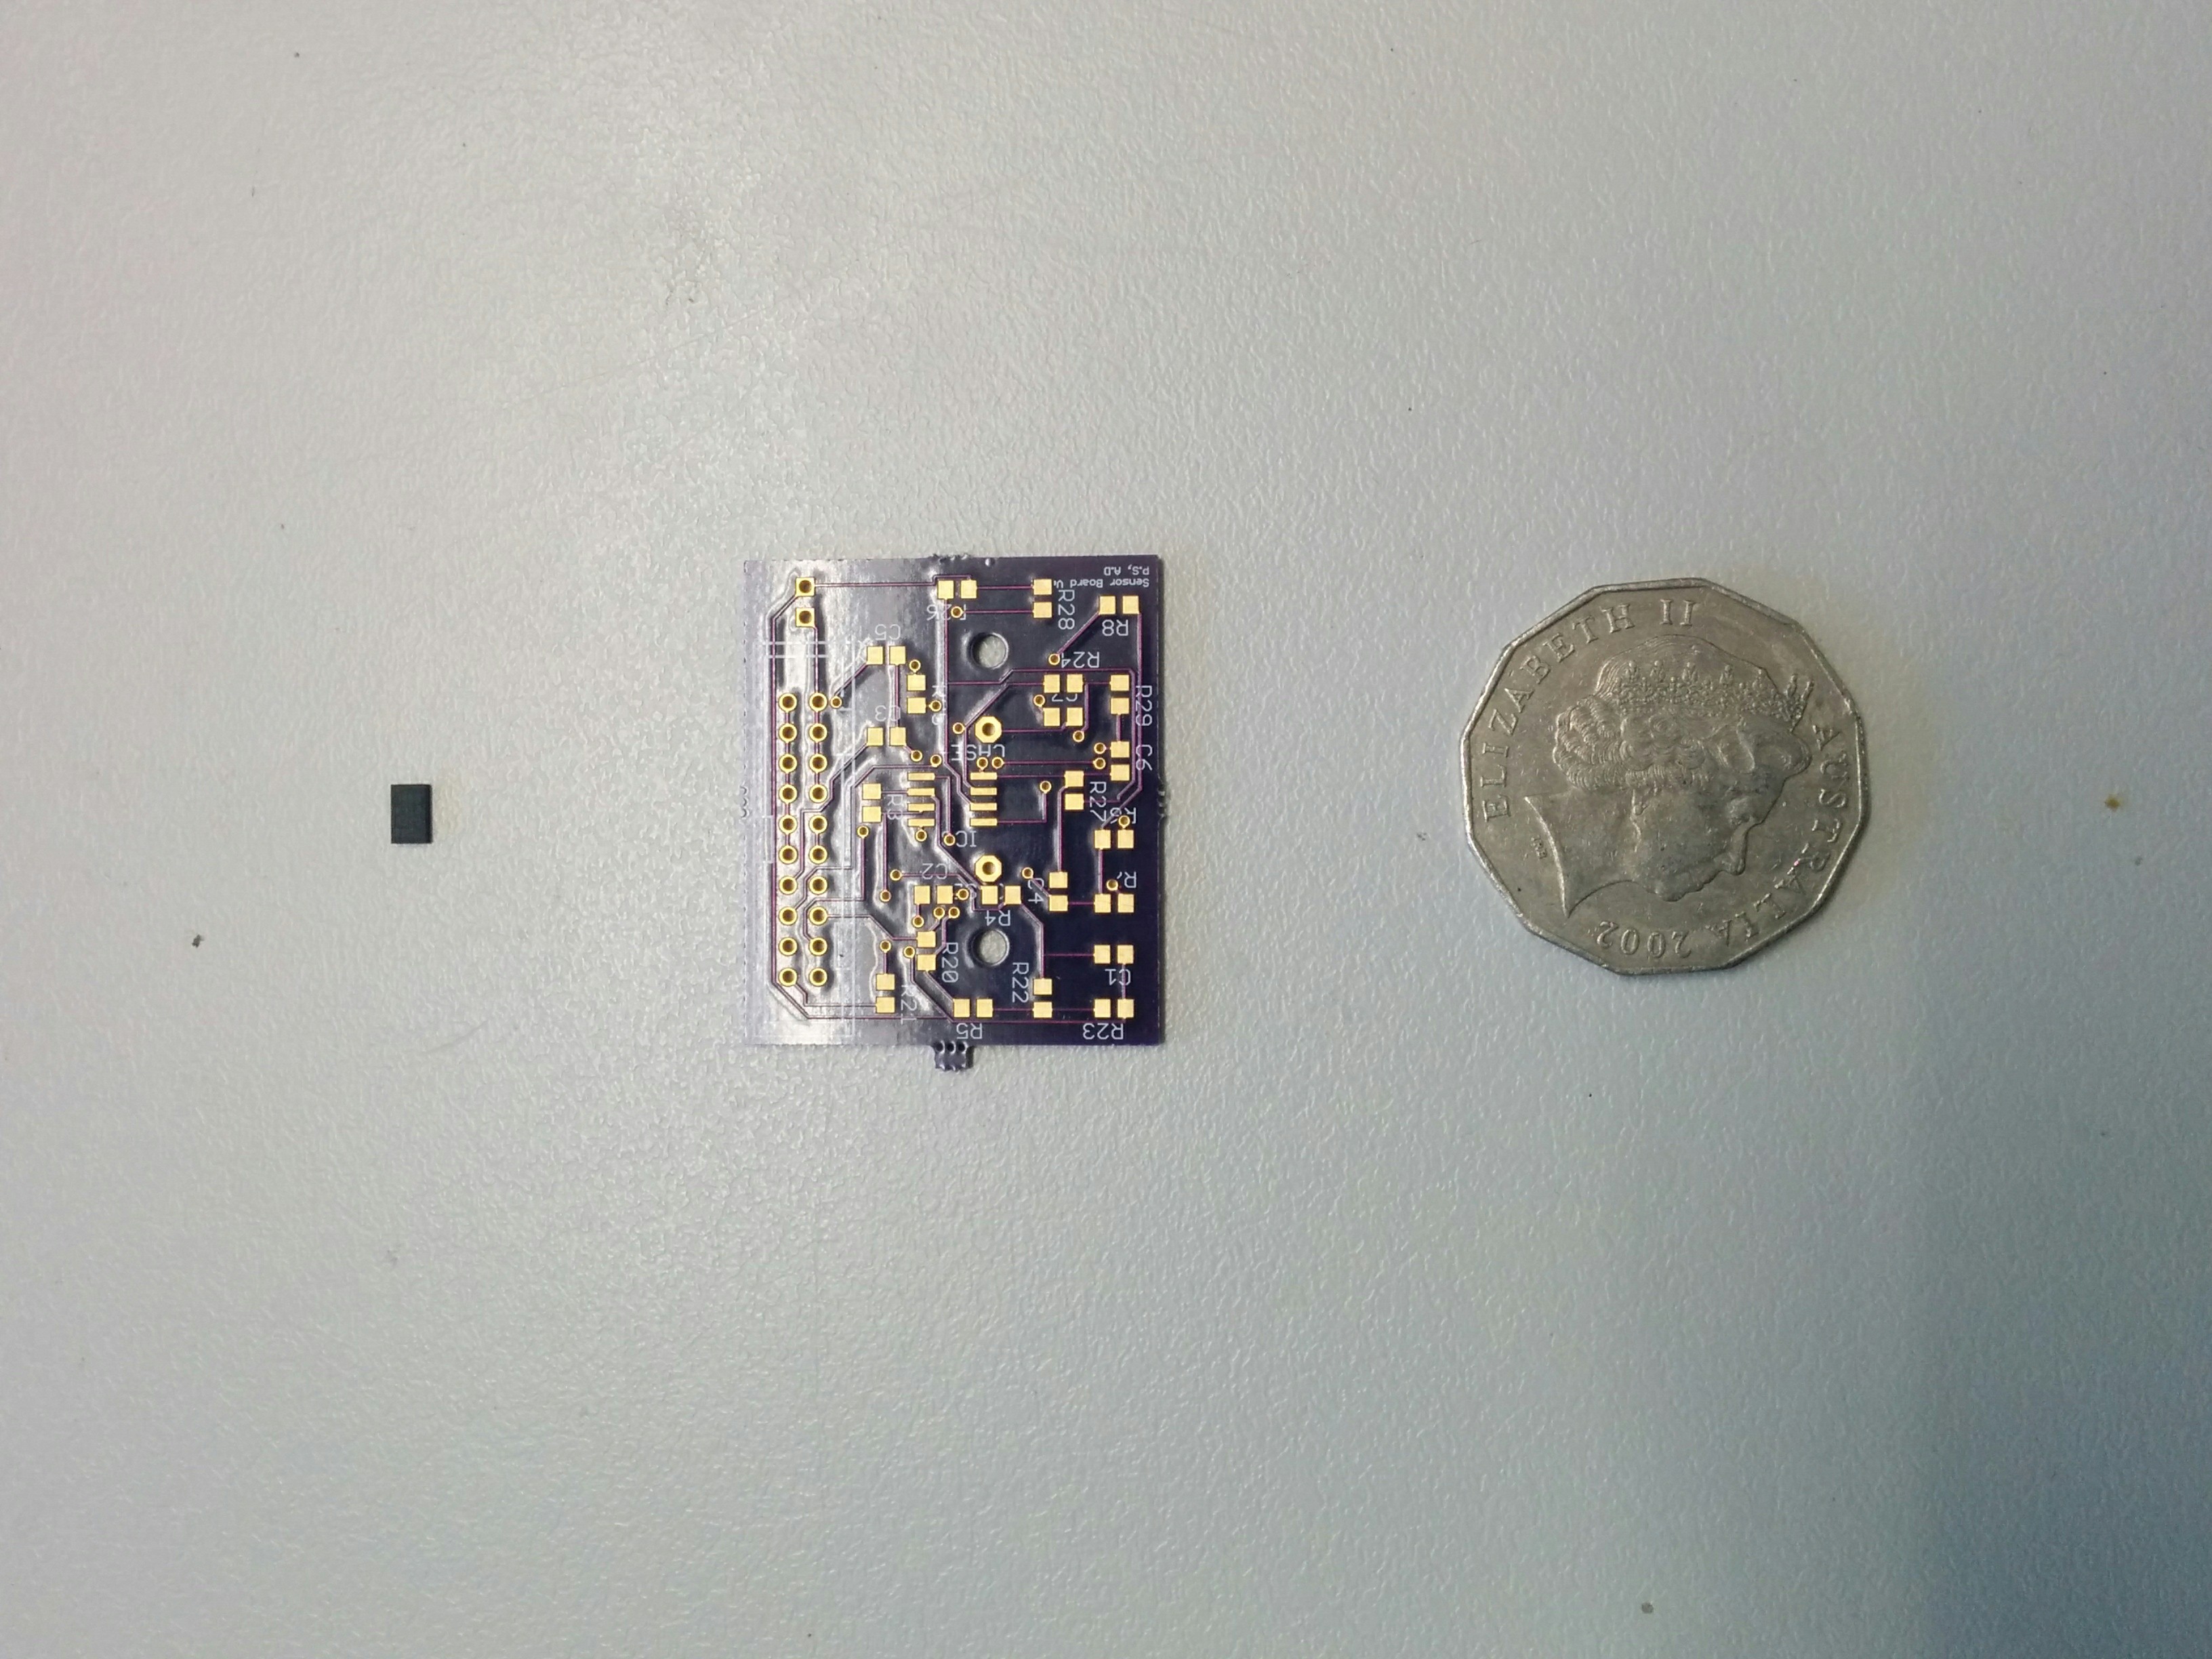
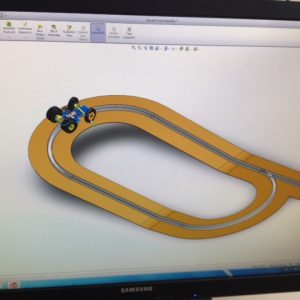
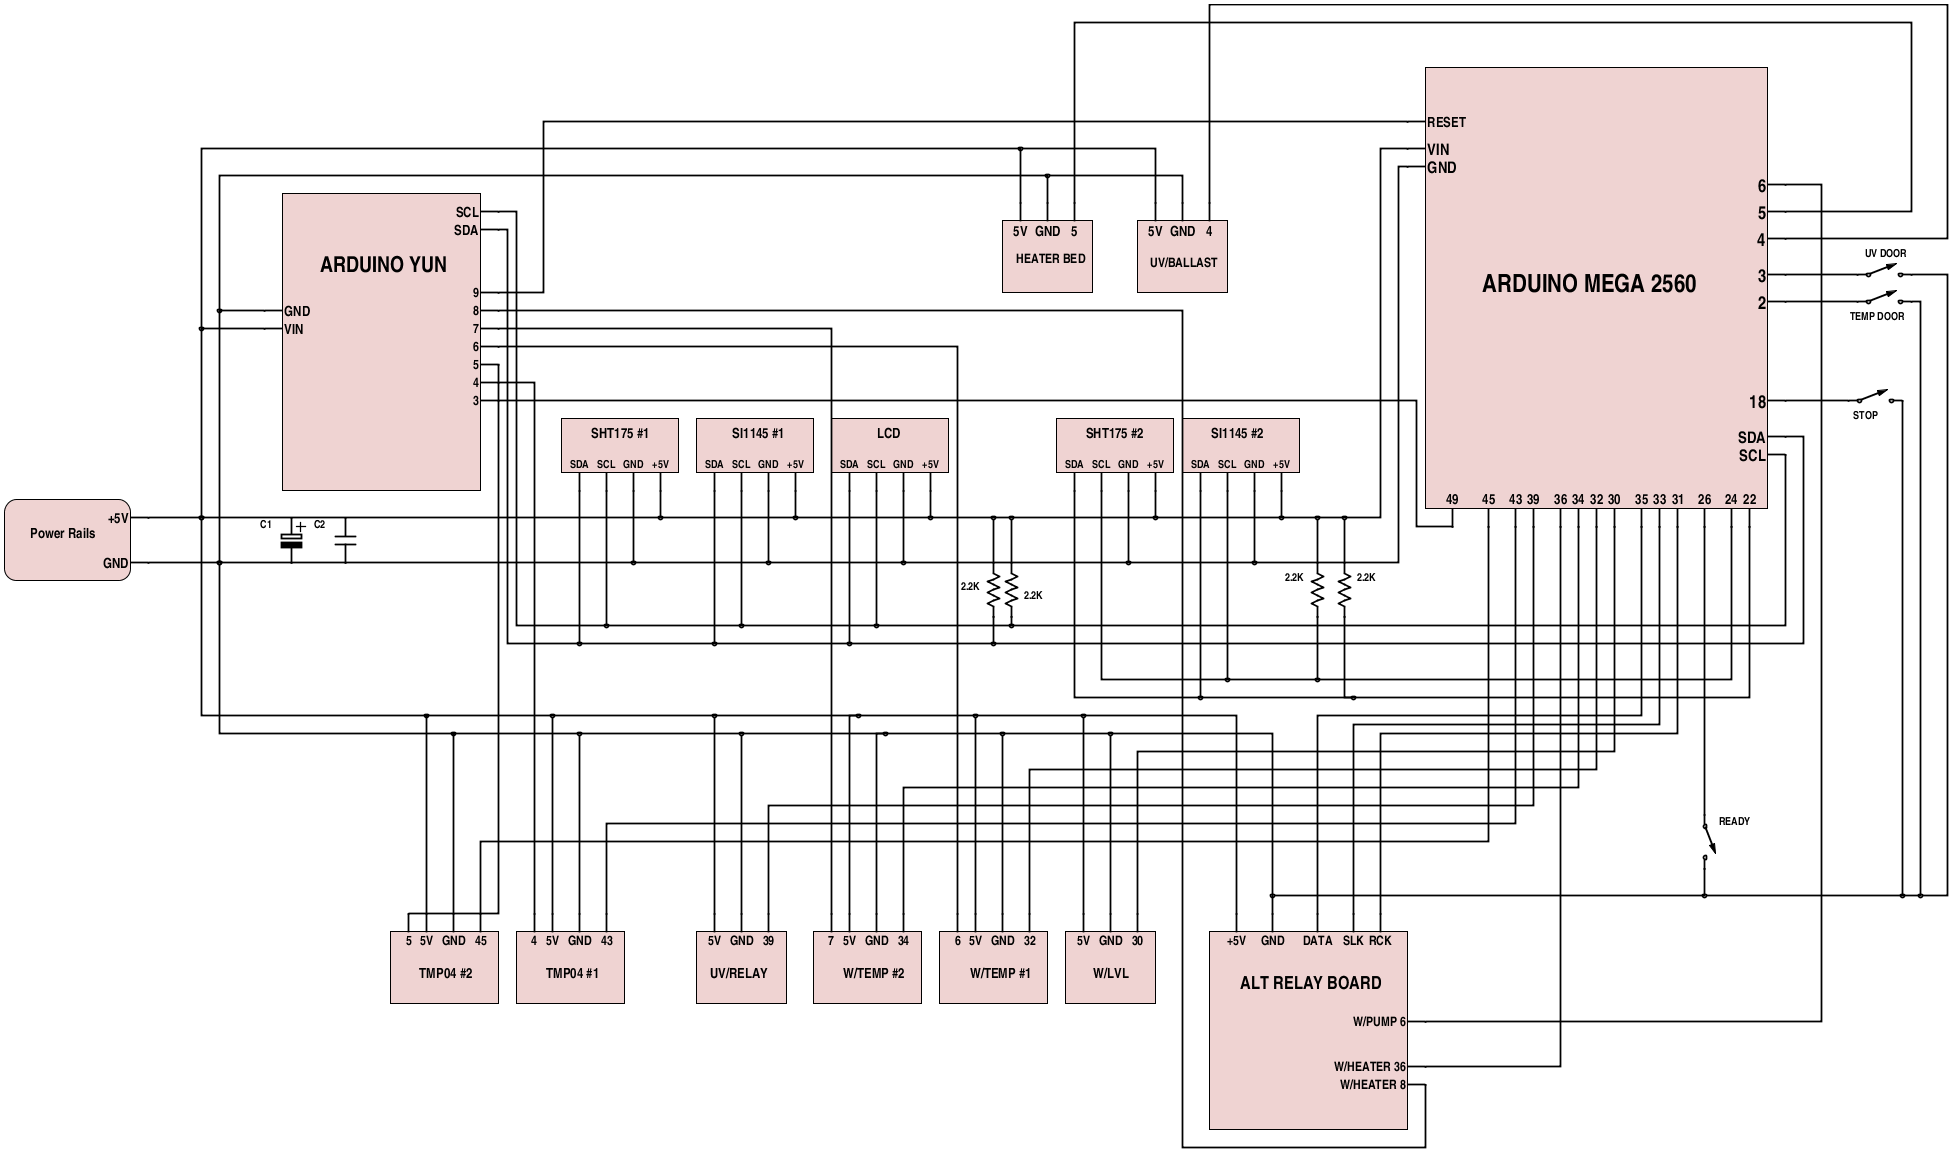
Thanks to the advances in rapid prototyping, it is incredibly easy to produce PCB’s in low quantities whilst keeping cost to a minimum. We had designed and manufactured our own PCBs to support this project. The PCB houses the accelerometer, a temperature sensor, a voltage and current sensor and a various other electronics. This test setup cost us <$100.


Challenge #1: Data storage:

The Arduino lacks an onboard flash storage. Therefore it requires an external storage space to store the data. An SD card shield is the simplest solution to overcome this problem. This method however, has one big disadvantage and that is the speed at which data can be written to an SD Card. Every time the Arduino has new data to be written to the SD Card, a file in the SD Card has to be opened, the data written and then closed. Failure to close it at the end of each data entry may result in corrupt data. The process of writing to an SD Card is slow and is subsequently one of the biggest  limitations to recording high frequency data.

Solution: Buffer memory

The Arduino has 512kb of Random Access Memory (RAM) which has a much higher read/write speed than any external flash storage. So by writing to this memory, then transferring it in chunks to an external flash storage at once, we are able to record data at much higher frequencies. However, the measly 512kb RAM posses severe limitations to the number of data points that can be obtained. We are limited to around 500 data points before the the RAM fills up and  requires to be transferred to the SD Card. The Arduino is also incapable of collecting any new data whilst this transfer is in progress. This means that the vibration data is not continuous and can only be obtained in small chunks. There are methods to increase the RAM of the Arduino using external RAM modules, which would enable us to increase our sample size significantly. But that is a different challenge on it’s own, and one we will hopefully tackle in the near future.


Challenge #2: Obtaining consistent data 

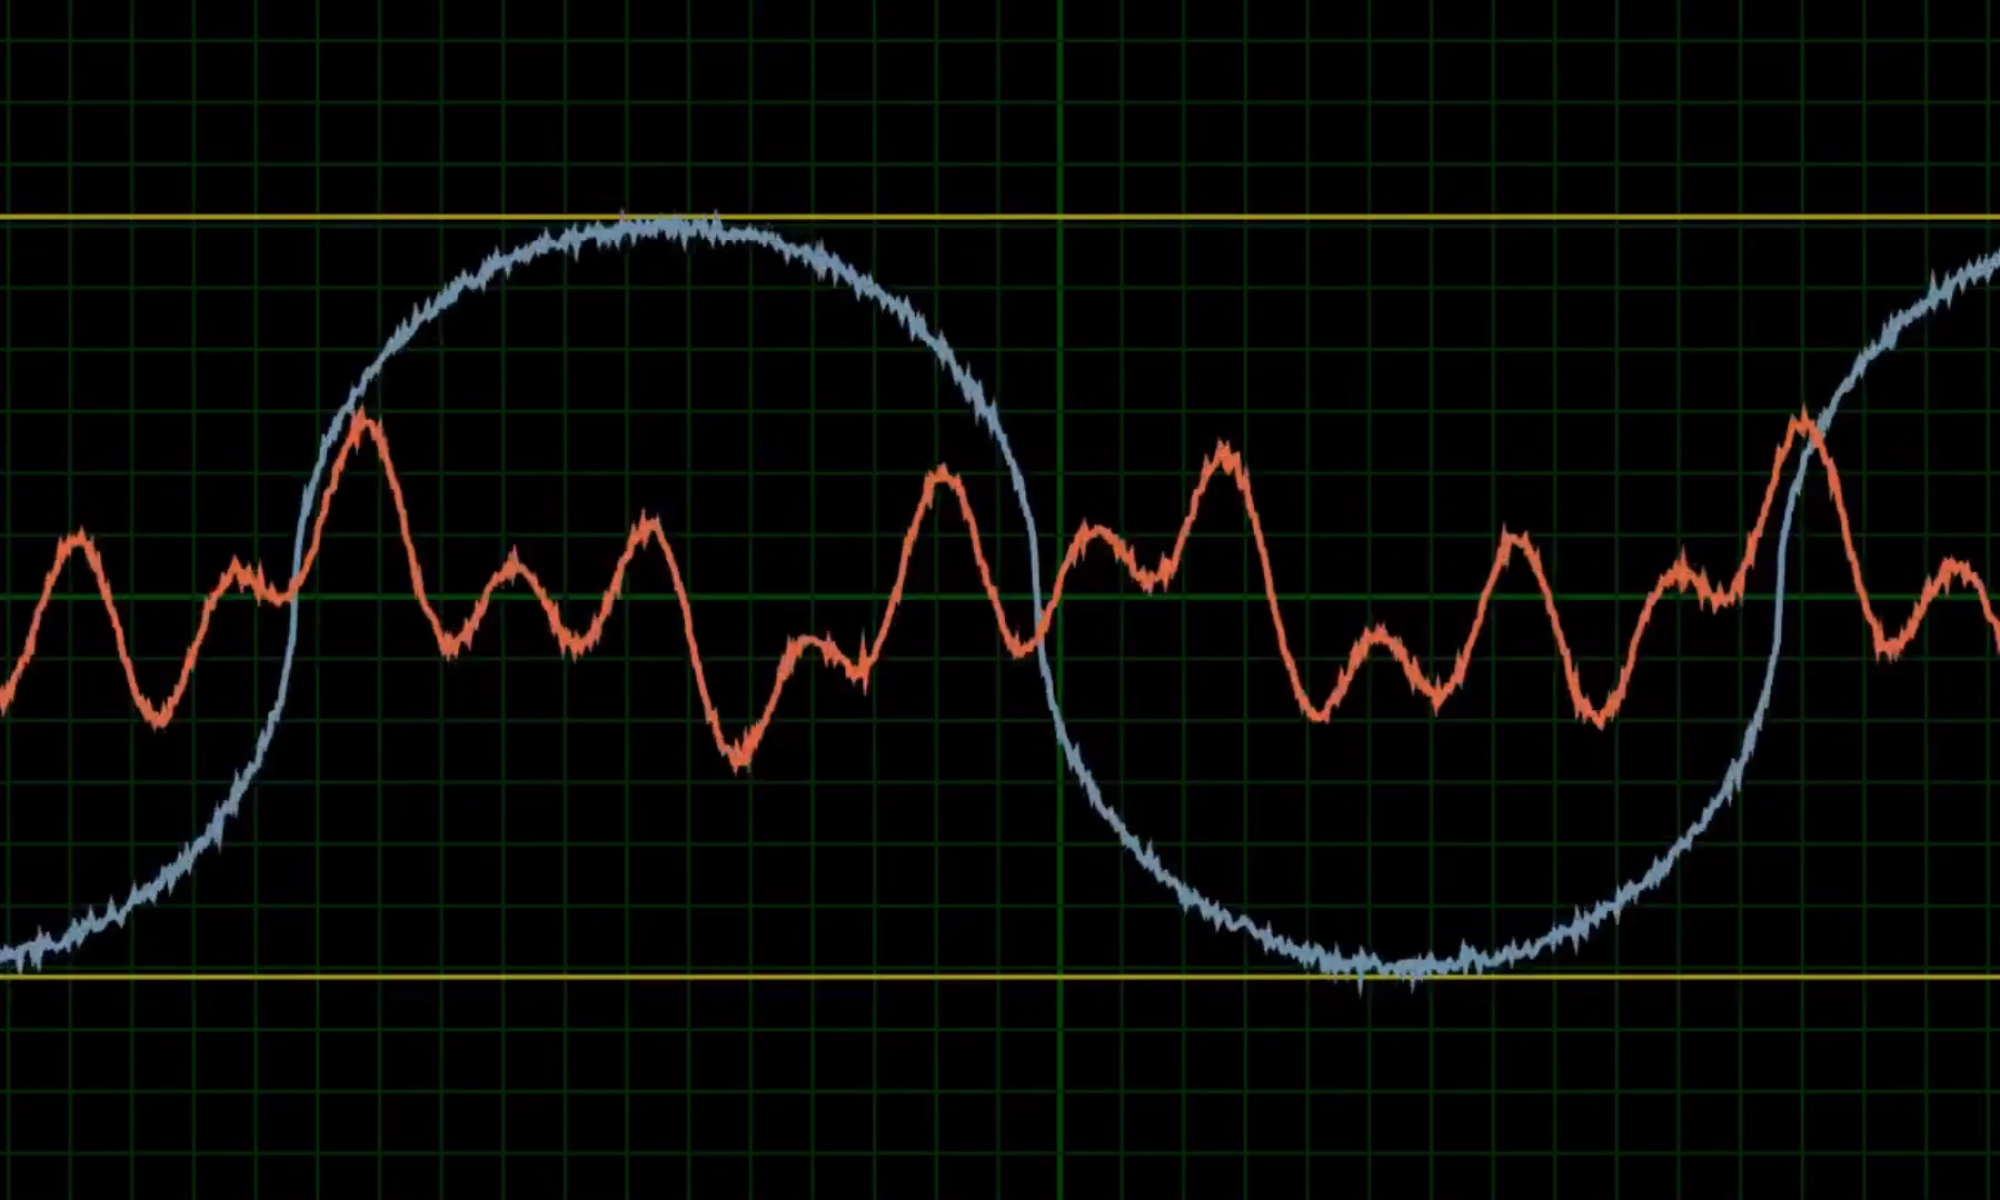
This issue is most relevant for vibrational data.

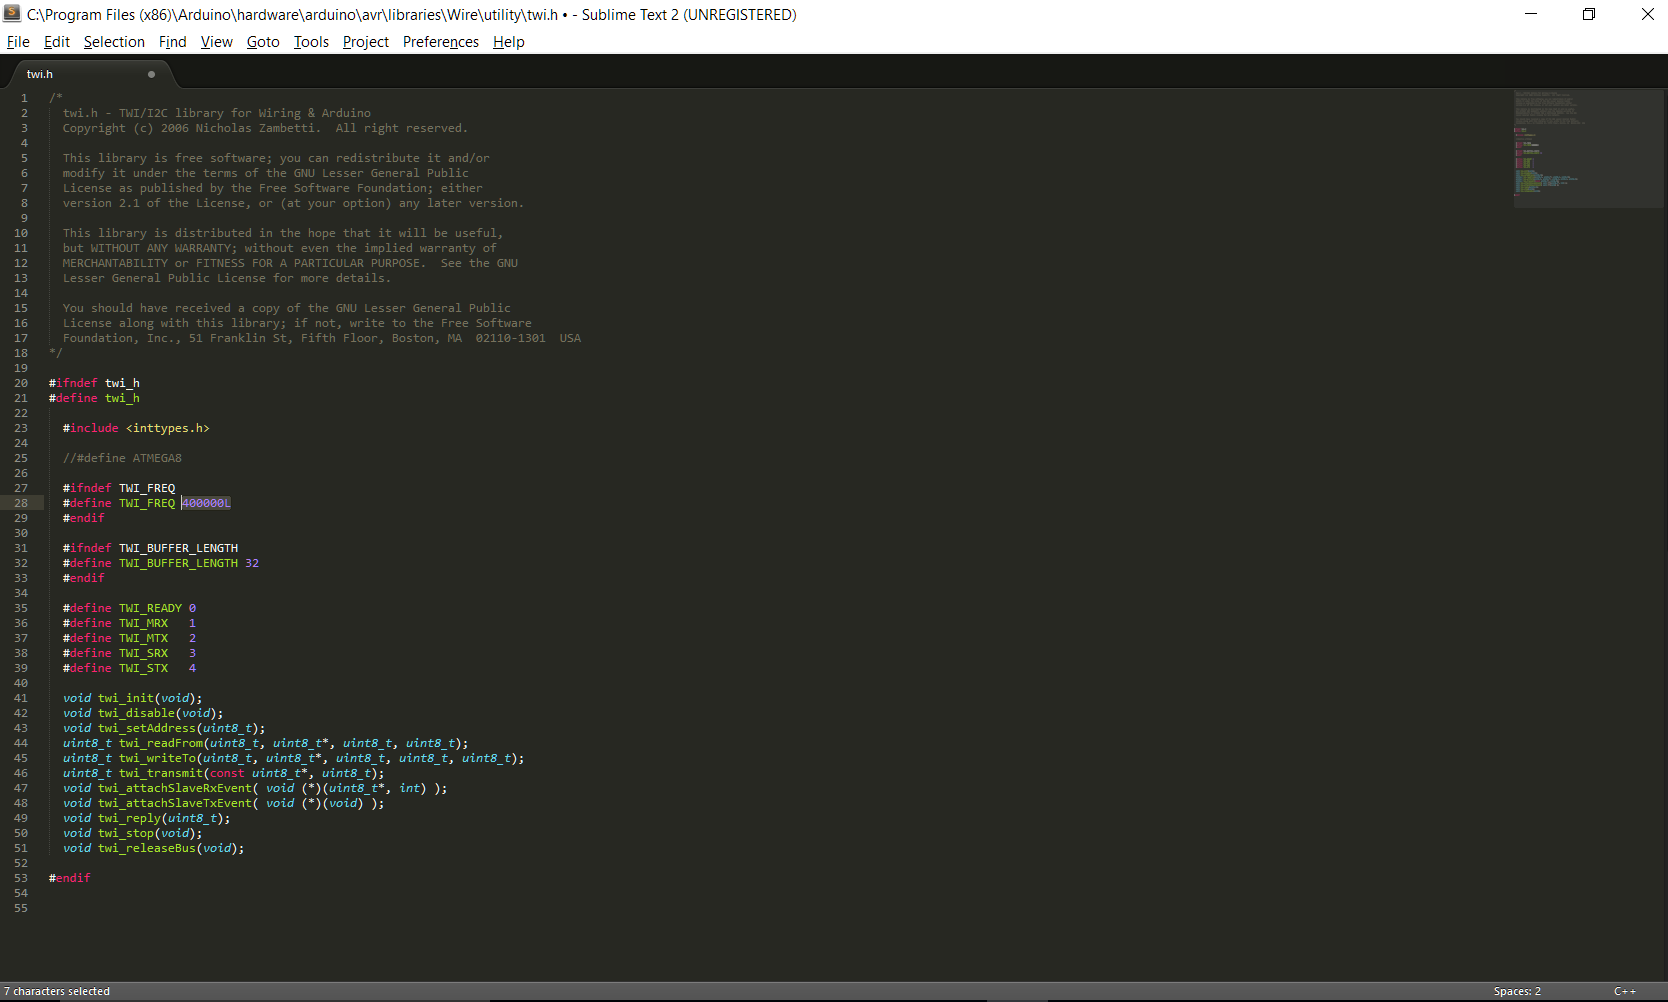
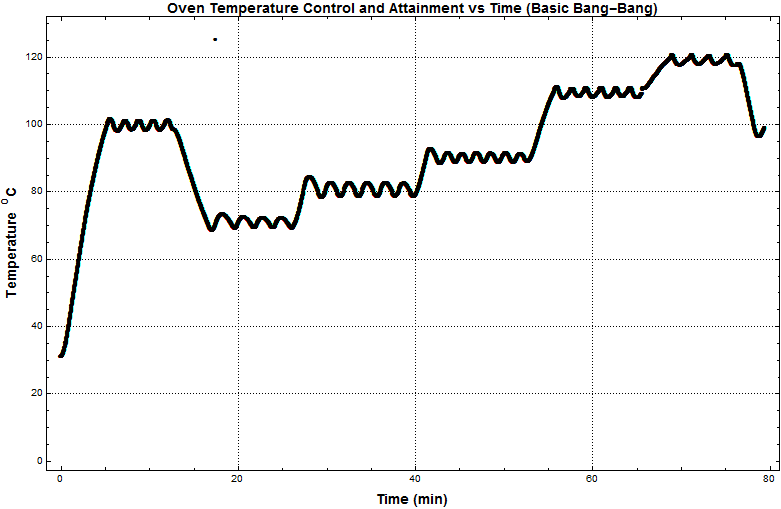
The ADXL345 supports a maximum Output Data Rate (ODR) of 3200hz on SPI and 1600hz on I2c. Our test rig is currently configured to use I2C. To understand this challenge, some knowledge of the Arduino’s operation is required: The Arduino continuously carries out a set of instructions in a conditional loop. It can be configured to request data from it’s sensors each time the loop is executed. The time taken to complete the instructions inside the loop is very inconsistent and therefore, the time interval between each data point can vary. This inconsistency can severely affect some time sensitive data such as vibrational data. Without a fixed ODR, the vibration data is essentially useless.

Solution: FIFO Buffer

Luckily, one of the ADXL345 chip’s distinguishing features, is the inclusion of a First In First Out (FIFO) buffer. The chip continuously collects data at a fixed rate, stores it in it’s FIFO buffer, and triggers a watermark when the FIFO buffer is full.  The Arduino can be configured to continuously scan for this watermark and transfer the data from the FIFO buffer onto it’s RAM upon the watermark’s signal. This guarantees a fixed, consistent ODR.  Ofcourse, this only works because the Arduino can poll the accelerometer at a faster rate than the accelerometer is collecting data.


Challenge #3: Accuracy

Coming soon: We are testing this and will update shortly.

Praveen Sundaram

Research Assistant

System Health Lab, UWA

Connecting to an Access Database using PHP

So recently I started using Microsoft (MS) Access which is the Database Management System (DBMS) in the MS Office Suite. While it presented a very interactive and pleasant graphical user interface (GUI), I started running into problems when I wanted to access the data online. While it was straightforward enough to do so with SharePoint, my team and I didn’t want to go down that road as we wanted the database to integrate well with other parts of web development and not be constrained to Sharepoint. That’s when a colleague of mine, Joanna Sirkoska landed upon ADOdb which allowed us to use PHP to connect to an Access Database.

In this post, I’ll briefly go through how you can connect to your chosen Access database and display the information within it using queries. The script to do so is quite straightforward and you can find it at this link. With this script you’ll either need to modify it to use your database or use the same database that I did which I have provided here.


I’ll run through some of the code here which should hopefully make things clearer if the comments in the script are not clear enough.


First of all you need to make sure you have the following line before trying anything else:

include(‘C:\wamp\www\adodb5\adodb.inc.php’);

To do so, check out the ADOdb link at the start and download the package. Then decide where you want to put it and make sure you change the line to reflect your path choice.


Then we need to connect to the chosen database:

$conn = new COM(“ADODB.Connection”) or die(“Cannot start ADO”);

$connStr = “Driver={Microsoft Access Driver (*.mdb, *.accdb)};Dbq=C:\Apache24\htdocs\DataCodes.accdb”;

$conn->open($connStr);

The first line creates an instance of the ADO connection object. You’ll need to edit the second line to match the database you choose to use. Finally the last line opens a connection to this database.


Next we have to execute a query:

$query = “SELECT * FROM tblEquipClass”;

$rs= $conn->execute($query);

I’ve chosen a fairly simple query which which get all the information contained within the table ‘tblEquipClass’. Then I execute the query storing the results within the variable $rs.

An easy way to view the information contained within $rs is printing out the information within it:

while (!$rs->EOF) {
print $rs->fields[2].'<BR>’;
$rs->MoveNext();
}

This while loop allows you to iterate through each line of data from the table. We then print only information from the third column out.

Finally we can close the connections made previously but that is optional.

There you have it! Now you can design your tables using the nice GUI MS Access provides but allow greater connection to your database using PHP. Leave a comment if you found this useful or have any queries.

Speeding Up I2C Communication

So recently we were doing some data collection with an Arduino mega and an accelerometer, specifically the ADXL345. Now the datasheet on the ADXL345 stated that the maximum sampling frequency is 3200 Hz but we found that our data points we only coming through at about 900 Hz. After some digging around the web, we found a potential cause.

Although the Arduino should be able to handle up to 400 kHz I2C communication, it is by default limited to 100 kHz in a particular library header file. Now 100 kHZ should be more than enough to sample a device which is supposed to be capable of 3200 Hz sampling but it’s not as straightforward as that. We think that although 100 kHz is the I2C bus speed, there is still going to be some time initiating communication. Depending on the library you choose to use. there could be several back and forths between the Arduino and the ADXL345 before any data is actually exchanged.

We found however that by making the change to 400 kHz, we were able to obtain data at 2600 Hz which while not maxed out, is still a significant improvement! Perhaps the remainder is due to the aforementioned communication overhead. Here’s what we did to obtain the increased bus speed as laid out at this link.


Locate the twi.h header file at this location: C:\Program Files (x86)\Arduino\hardware\arduino\avr\libraries\Wire\utility.

Now instead of just telling you the full path, I’ll provide a picture as well so you can confirm you’ve found the correct file (note the path in the top right corner). I2C Pre Change

Once you’ve located the file, note the highlighted section. This is the default value provided when you download the Arduino software. Change the 100000L to 400000L. It’s a simple as the picture below!

I2C Post Change


And that’s pretty much it!

You’ll need to let Arduino recreate the associated object files but this is simply a matter of restarting the Arduino IDE. You should notice an increase in your I2C communication! Mind you that you’ll have to be talking to a device capable of making use of this increased speed (like we had with the ADXL345).

I won’t claim to know all the maths behind this so if you know more, please share your knowledge with us in the comments section! Alternatively if you found this a useful link, leave that in the comments too!


Ashwin D’Cruz

Research Assistant

System Health Lab, UWA

General Design Process and Philosophy (Part 3)

Once we knew what we wanted to do, all that was left was to do it! This was not a quick process however. We discovered that knowing what we wanted to do and knowing exactly how to go about doing it were quite different things. There was a lot of Googling involved. Thankfully, most of our design tools were popular and well documented, specifically Solid Works for the mechanical aspect and Arduino for the electronic and programming side of things. We also drew heavily on our previous experience, pulling ideas and skills from seemingly unrelated previous projects. During the early stages, there was not much programming as we focused more on building a basic test rig, even if it lacked sophisticated sensors and data communication. As such, Solid Works was used a lot. We would design the different components separately and then use CAD to see how it fit it within the larger assembly. There were many iterations to get it all right but eventually we completed it. Once we were satisfied with our CAD drawings, we took it to the workshop and had it produced.


ADT Chamber: Preliminary Test Data

Preliminary tests on the operating range and control of the environmental variables within the chambers has been conducted. Results are very positive, with humidity generation and control exceeding expectations, and temperature extremes being easily attainable with no failures. Unfortunately UV output is less than expected.

Humidity Control Tests:
Humidity control is required for both chambers. For the UV chamber preliminary testing shows that the humidification system can raise the humidity level in the chamber to 80% in under 5 minutes from an ambient of ~35%RH.
With the testing parameters used the Humidity system struggled to achieve 90%RH in the given time. The dehumidifier is effective, but slow. It is effective at maintaining a low ambient humidity, but not rapidly lowering the humidity level.


Humidity test for UV chamber. 20 minute set points at 60%RH, 80%RH, 90%RH and 70%RH Blue - Relative Humidity Orange - Temperature
Humidity test for UV chamber. 20 minute set points at 60%RH, 80%RH, 90%RH and 70%RH
Blue – Relative Humidity
Orange – Temperature

We can see that control is excellent. Achieving tolerances below +-1%RH. Additionally, we can see that the humidifier has minimal impact on the temperature of the system.


For the oven we can see that control is also excellent. Multiple temperatures are yet to be tested.

80%RH Set Point. Shows the high precision of control within +-1% RH


Temperature Control Tests: 

Temperature is being controlled by a simple Bang-Bang control algorithm. A PID algorithm has also been implemented and tested, but results are still poor due to additional parameter tuning required.

The graph below illustrates temperature control within the oven with 15 minute set point intervals and no insulation. Insulation has been added since this preliminary test. We can see we easily achieve the required temperature of 120C, and can control temperature within +-2C.  With insulation and a tuned PID it is expected that these results will improve. However, this test confirms the core functionality of the temperature system.

This graph illustrates the temperature within the chamber with Bang-Bang control.

Ultraviolet (UV) System: 

The UV system is designed to output in the UV-B spectrum, to maximise degradation. Initial tests have shown that UV-B levels within the chamber are approximately equal to that of Peak Sunshine on a Hot Summers day in Perth. This corresponds to an output of 3mW/cm^2.

Output is fully controllable between this maximum value and 20% of this maximum.
We had hoped for an output of approximately 5 times this.

Master Wiring Diagram

ALT Wiring Diagram

Above is the Master Wiring Diagram. This schematic details all the electrical connections required for the ALT project. Additionally, it labels all the micro-controller pins required. The Arduino Mega is used to process all I/O functions, while the Arduino Yun manages data-logging functionality.

Sub-systems have been kept together and connections spaced out to aid debugging. Certain time critical functions are attached to interrupt pins, such as the Door switches and safety resets.
Finally, as a fail-safe, certain sensors report to both the Arduino Yun and Mega. This allows either micro-controller to reset the other in case of an error or lock up. Each processor also has control of safety critical functions and can cut power if required, minimizing risk.

-Rohan

Progress Update: Humidification System Design

The Requirements Analysis and Design Document has been completed! From this the final designs and schematics of the various subsystems have been completed. In this post we look at some of the details of the Humidification System.

Humidification System: 

The following block diagram gives an overview of the system and it’s various components.

Block Diagram Summary of Humidification System

In reality, however, there will be two test chambers connected to other system elements, all controlled through the MCU and the valving.

Humidity Generator: 

Several different humidity generation schemes were considered, but the final design was chosen based on Reliability, Cost, Portability and Safety considerations.

The final design is an active bubble humidifier, which humidifies air by bubbling it through a warm water bath. This design is highly reliable and safe. It can be operated completely on DC voltages and components are easily sourced and cheaply available.

The final design for the Humidity Generator. Air is bubbled through warm/hot water and is pumped into the test chambers. The entire air path is closed, allowing humidity to build upon itself (increasing efficiency), retain test chamber heat, and reduce potential for harmful fumes escaping the test chamber.

Dehumidification: 

In order to conduct tests below ambient humidity a dehumidification system is required. After considering multiple dehumidification options a replaceable and recyclable chemical desiccant was chosen.

A chemical desiccant 'snake' is used for dehumidification.
A chemical desiccant ‘snake’ is used for dehumidification.

A silica gel desiccant was chosen due to its easy and cheap availability, excellent absorption characteristics and high temperature operation.

Humidity Valving: 

A single Humidity Generator and Dehumidifier needs to be able to service both test chambers. In order to achieve this a valving system is required to switch airflow as required. High temperature valves are required due to oven operating temperature. The system is also low pressure, requiring direct acting valves. Single way valves were chosen for cost, simplicity and sourcing reasons.

The valving and tubing for the humidification system is summarised in the above pneumatic schematic.
The valving and tubing for the humidification system is summarised in the above pneumatic schematic. “Diode Symbols” represent one-way check valves, “switch symbols” represent direct acting, one-way solenoid valves. Y-connectors are used to join 3 tubes together.

Humidification Valve Driver: 

In order to control all these valves, an amplification circuit is required to convert the MCU signal into power for the solenoids. Additionally, in order to minimise the number of MCU pins required a High Power Shift Register and Relays are used to convert a serial 5V signal from the MCU to a parrallel 12V signal to drive the solenoids. This electrical schematic is shown below.

Electrical Schematic of the circuit required to amplify and interpret the MCU signal into a power signal to drive the Solenoid Valves. The circuit also contains elements to amplify and drive the DC Air Pump as well as the Heaters for the Humidifier.

Construction: 

Most of the components for the humidification system have arrived and construction is well under way.

Until next time!
-Rohan

Farewell to our Zhejiang visitors

We said farewell to Hailin Luo, Cheng Luo, Wanlin Chen and Zhexu Ni on Saturday 22nd August. They returned to Zhejiang University to complete their BEng(EE) studies. They were with us for 3 weeks. Hailin developed a Labview controller for Alex Clegg’s motor test rig and Cheng, Wanlin and Zhexu designed printed circuit boards for the run-to-failure test truck. Great job done by all including our students who looked after them.